


 Close Menu
 World
 Biography
 Health
 Education
 Business
 Lifestyle
 Sports
 Technology
 Animals
 History
 Food
 Religious
 Startups
 Movies
 Politics
 Fashion
 Covid
 Diet
 Fitness
 Marketing
 Travel
 Science
 Reviews
 Social media
 Stories
 Facts
 Art
 Entertainment
Retensa

Business
Employee Retention Software for CHROs and CFOs: Shared Definitions, Shared Targets, Shared Results
 Retensa
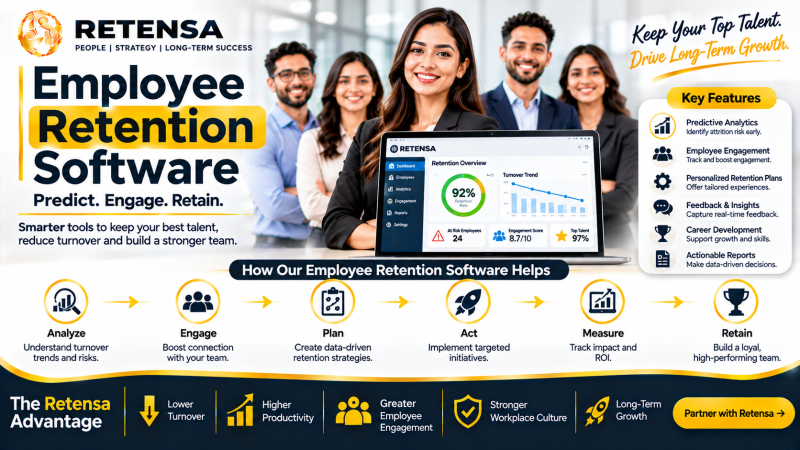
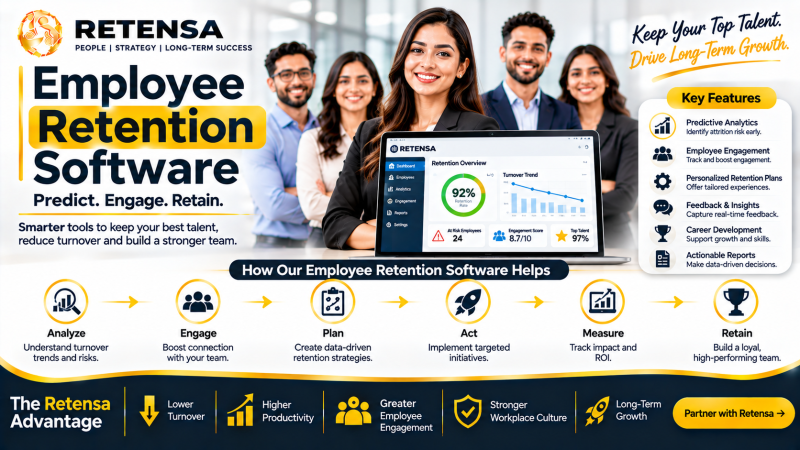
Employee retention software gives CHROs and CFOs a common language for turnover, which is the first condition for acting on it together. The U.S. Bureau of Labor Statistics reported 3.4 million quits in September 2026, and Gallup estimates that replacing one employee costs between one-half and two times annual salary. When HR and finance read the same numbers from the same employee retention software, budget conversations move from debating the data to deciding what to do about it.
Retensa is a data-driven employee retention platform that provides diagnostics, predictive analytics, and survey software built on 25 years of retention science. It serves more than 1,000 employers across 59 countries and 22 languages. This guide shows CHROs, CFOs, and finance leaders how to agree on five shared definitions, divide responsibilities, and report one scorecard that both functions trust.
Two Functions Share One Number
HR sees turnover as a people issue, and finance sees it as a cost. Both views are correct, and each one is incomplete without the other. HR knows why employees quit but often lacks a dollar figure. Finance knows what exits cost but often lacks the drivers behind them. Retention software joins the two views.
The size of the number explains the urgency. Gallup calculates that a 100-person employer with a $50,000 average salary faces roughly $660,000 to $2.6 million in annual turnover and replacement costs, and Retensa data places the cost between $10,000 and $100,000 per employee. Gallup found that 52 per cent of employees who quit voluntarily say their manager or employer could have prevented the exit, and Retensa data indicates that 94 per cent of turnover is preventable.
Consider an illustrative employer with 2,400 employees and 17 per cent annual turnover, which loses 408 people a year. At a $70,000 salary and Gallup's 0.5 replacement multiplier, each exit costs about $35,000, so annual turnover costs about $14.3 million. A 12 per cent reduction, the low end of Retensa's published results, retains 49 employees and preserves about $1.7 million. The figures are illustrative, and the employer's own data replaces them.
Five Shared Agreements Make Retention Reporting Credible
Each agreement below removes a common source of disagreement between HR and finance. Each one also produces a metric that both functions can verify.
1. One Definition of Voluntary Turnover
HR and finance sign a written definition of voluntary turnover, including how part-time, seasonal, and fixed-term roles are treated and which date marks the exit. The Retention Metrics Dashboard reports the agreed measure in real time, so both functions see the same figure.
The metric is a signed definition before the first report, and the target is zero restatements in the first year.
2. One Cost Basis
Executives who want to know how to reduce employee turnover need one agreed cost per exit. Retensa's cost of turnover calculator converts headcount, turnover rate, and salary into an annual cost figure in under 60 seconds, and the Total Cost of Management calculator extends the view to the full expense of each role.
Finance selects one replacement multiplier within Gallup's range and applies it to every report. The metric is a documented cost basis that both leaders have signed.
3. One Baseline by Segment
Leaders who aim to decrease turnover rate need baselines by function, location, tenure, and manager. The Retention Diagnostic identifies the 24 attractors and detractors that pull employees in or push them away, then ranks and trends each by department, tenure, and role.
The output is a baseline turnover rate and a ranked driver list for every major segment.
4. One Target and One Date
The target names the segment, the starting rate, the goal, and the review date. Retensa's published results show turnover reductions ranging from 12 per cent to 67 per cent, so finance chooses a conservative point inside the range for planning.
5. One Return Test
Retensa backs its solutions with a contract-backed guarantee: if voluntary turnover does not fall, the employer does not pay. Finance compares avoided turnover cost with the investment each quarter and reports one ratio to the board.
Clear Responsibilities Keep the Work Moving
Shared agreements work when each function knows what it owns. Three divisions of labor cover the program.
1. The CHRO Owns Drivers and Actions
The CHRO runs the employee retention program: the driver ranking, the risk view, and the manager actions. The Attrition Risk Matrix categorizes employees by resignation likelihood, and TalentPulse applies machine learning to predict workforce connectedness, loyalty, engagement, trust, and risk.
Gallup research shows managers account for at least 70 per cent of the variance in team engagement, so the CHRO funds Retention Skills Training, which teaches managers the conversations that matter. The metric is the share of high-risk employees with a documented conversation within two weeks.
2. The CFO Owns the Cost Basis and the Return
The CFO validates the cost per exit, confirms the savings calculation, and signs off on the return ratio. In the 2,400-employee example, each percentage point of turnover removed retains 24 employees, worth about $840,000 at the same assumptions.
3. Both Own the Quarterly Review
The CHRO and CFO sit together at the quarterly review and approve the next quarter's priorities. A written staff retention plan records the owners, targets, and review dates, so the decisions survive changes in leadership. The metric is the share of reviews held on schedule.
A Shared Scorecard Replaces Two Reports
One page serves both functions. It reports voluntary turnover by segment, cost of turnover, count of high-risk teams, and the top driver by share of exits. ExitPro automates exit interviews, analyzes the responses, and identifies the primary and secondary drivers of turnover across departments, so the driver view stays current.
1. Lagging and Leading Numbers Together
Voluntary turnover confirms results, and risk-team counts and engagement trends warn early. Finance sees the cost of the lag, and HR sees the signal. Retensa reports that acting on predictive insights prevents attrition in as little as three weeks.
2. Segment Detail for Operating Leaders
Operating leaders receive the same numbers for their areas. Shared definitions mean that a leader in one region and a leader in another read the same metric the same way.
3. A Single Return Ratio for the Board
The board sees one ratio: avoided turnover cost divided by the investment to date. Consistent measurement from quarter to quarter lets directors judge progress without asking for new reports.
A Standing Agenda Keeps the Joint Review Short
The quarterly review works best on a fixed agenda that both leaders know in advance. Four items fill the hour.
1. Results Against the Baseline
Leaders open with voluntary turnover by segment against the baseline and target. The metric is the share of segments at or below target.
2. Cost and Return
Finance presents avoided turnover cost against the investment to date. Both leaders confirm that the cost basis has not changed since the last review.
3. Drivers and Risk
HR presents the top three drivers by share of exits and the count of high-risk teams. A falling share for last quarter's top driver confirms that a fix is working.
4. Decisions for Next Quarter
The meeting ends with three priorities, each with an owner and a date. The metric is the share of priorities with both, and the target is 100 per cent before the meeting ends. Each decision goes into the written plan so that the next review starts from a clear record. Over several quarters, the record shows which decisions produced results and which did not.
Engagement Benchmarks Anchor the Targets
Gallup's 2020 Q12 meta-analysis found that top-quartile engagement teams record 18 per cent lower turnover in high-turnover organizations and 43 per cent lower turnover in low-turnover organizations than bottom-quartile teams. Gallup also reports that global employee engagement fell from 23 per cent to 21 per cent in 2024 and that manager engagement fell from 30 per cent to 27 per cent.
The gap between an employer's strongest and weakest teams offers a practical first target. The metric is the share of teams that reach the engagement level of the current top quartile within four quarters.
Common Ground Produces Faster Decisions
HR and finance reach decisions faster when they read the same numbers. Five shared agreements, clear responsibilities, and one scorecard turn retention from a debate into a managed program. Gallup data shows that 52 per cent of employees who quit say their employer could have intervened, and that preventable share is the opportunity. Employers that apply the agreements can measure turnover reductions in the range Retensa has published, from 12 per cent to 67 per cent, with attrition prevention beginning in as little as three weeks.
Frequently Asked Questions About Retention Software for CHROs and CFOs
How can CHROs and CFOs agree on a turnover definition?
CHROs and CFOs sign a written definition of voluntary turnover that covers part-time, seasonal, and fixed-term roles and names the exit date. The Retention Metrics Dashboard then reports the agreed measure in real time, so both functions read the same figure.
How can finance teams verify the cost of turnover?
Finance teams multiply voluntary exits by a replacement multiplier within Gallup's one-half to two times annual salary range. Retensa's cost of turnover calculator converts headcount, turnover rate, and salary into an annual figure in under 60 seconds.
How can HR show finance which drivers deserve funding?
HR ranks drivers by share of exits and by dollar exposure. The Retention Diagnostic ranks 24 attractors and detractors by department, tenure, and role, and ExitPro reports each driver's share of exits, so finance sees which fixes carry the largest savings.
How can leaders report retention results to the board?
Leaders report one page each quarter: voluntary turnover by segment, cost of turnover, count of high-risk teams, top driver by share of exits, and the return ratio. Consistent definitions let directors compare quarters without new reports.
How can CFOs reduce financial risk in a retention investment?
CFOs require a baseline, a dated timeline, and a performance guarantee. Retensa's contract-backed guarantee means the employer does not pay if voluntary turnover does not fall, and each percentage point removed from a 2,400-person workforce retains 24 employees.
Source:
Click for the: Full Story
You might like







You Might Like this